
How to Build Production-Ready Azure Pipelines
Build CI/CD pipelines with tested merges, secure secrets, controlled deploys, and rollback plans.
May 29, 2026
DevOps Engineering

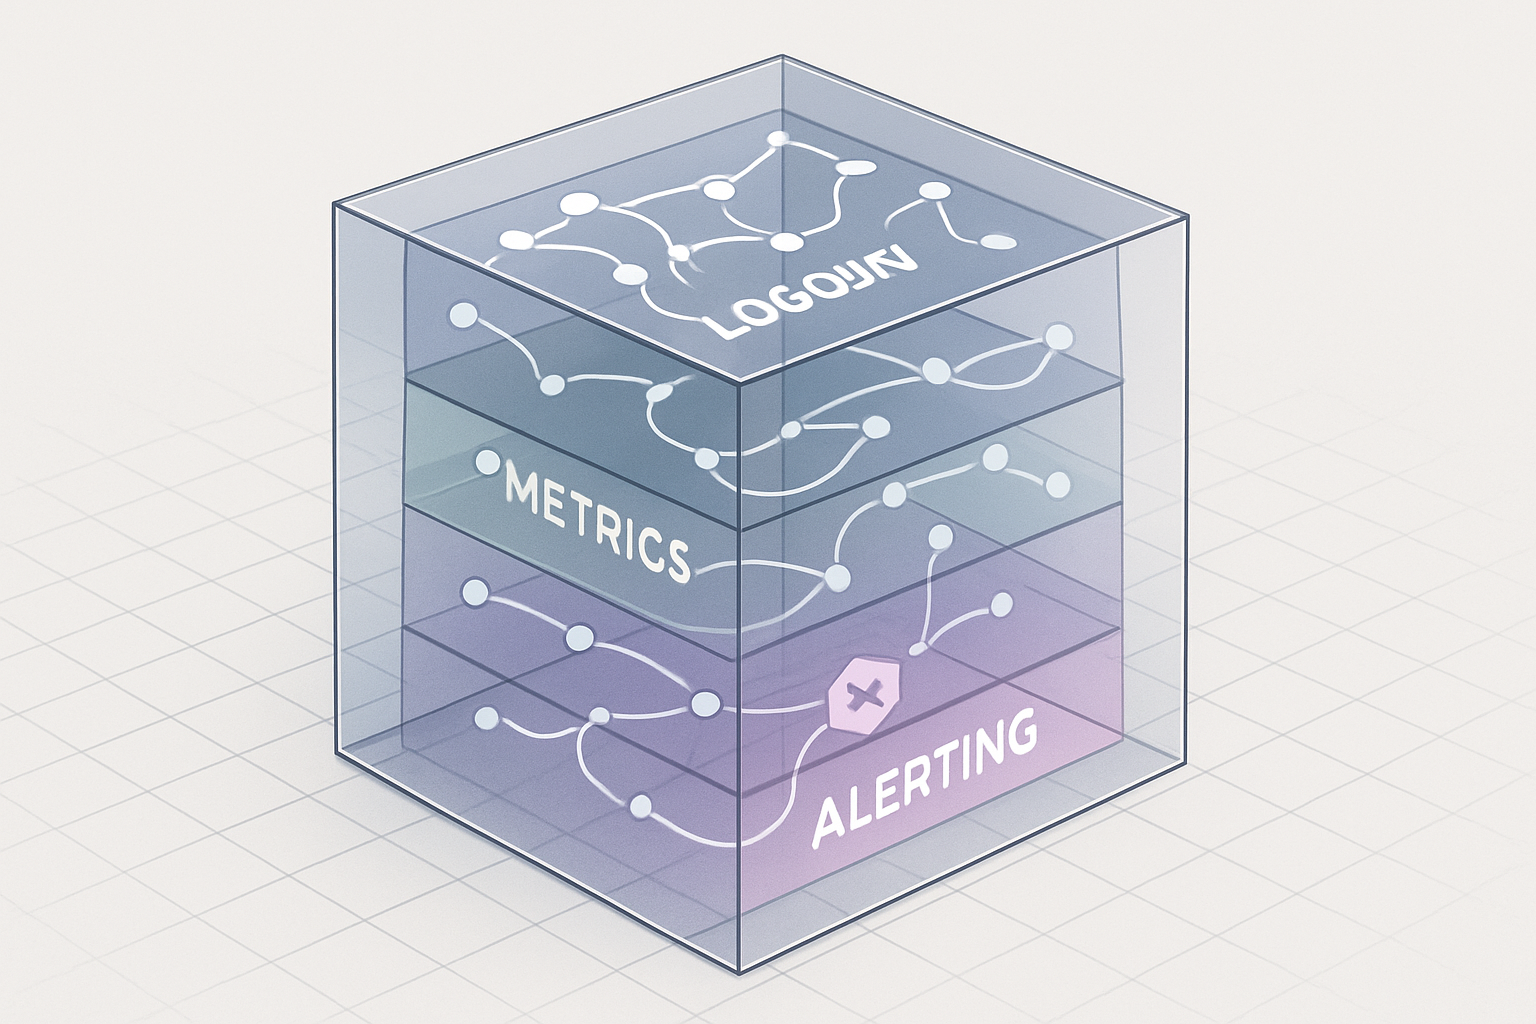
Select logging, metrics, tracing, and alerting tools that support startup growth.


Observability usually becomes urgent after the team has already felt pain: a slow production incident, a deployment that breaks one tenant but not another, or a database issue that looks like an application bug for two hours. Early on, logs and a few cloud dashboards feel good enough. As traffic grows, services split, queues appear, and on-call becomes real, that setup starts to fail.
A startup observability stack should help you answer three questions quickly:
You do not need a huge platform team or a costly enterprise setup to get there. You do need a clear structure for logs, metrics, traces, alerts, and ownership.
Before choosing tools, define the operational questions your engineers face during real incidents. This keeps the stack practical and prevents tool sprawl.
For a typical startup, the first useful questions are:
If your current setup cannot answer those questions in a few minutes, your stack has a gap. The fix is not always “buy a bigger tool.” Sometimes it is better log structure, useful dashboards, better alert thresholds, or cleaner service ownership.
This is also where you should separate observability from general monitoring. Monitoring tells you something crossed a known threshold. Observability helps you investigate unknown failure modes. You need both, but they serve different jobs.
Most startup observability stacks need four core components: logs, metrics, traces, and alerts. You can add more later, but these should come first.
Logs are event records. They help you inspect what happened inside an application or system at a specific point in time.
Good startup logging usually means:
A common failure mode is logging too much at the wrong level. If every successful request writes five large log entries, your bill climbs and engineers stop reading the output. Log what helps you debug state changes, failures, security-relevant events, and important business workflows.
Metrics are numeric measurements over time. They work well for dashboards, service health, capacity trends, and alerting.
Useful metrics often include:
Be careful with high-cardinality metrics, especially labels such as user ID, email, request ID, or raw URL paths with IDs embedded in them. They can make the system expensive and slow. Use labels that help you group meaningfully, such as service, route template, region, status code, environment, and deployment version.
Distributed tracing shows how a request moves through services and dependencies. It becomes valuable once a request touches more than one process, service, queue, or external provider.
Tracing helps when a user action goes through an API service, a worker, a database, a payment provider, and an email service. Without traces, each team checks its own logs and guesses where time disappeared. With traces, you can see which span consumed the most time and where the error started.
OpenTelemetry, often shortened to OTel, is a common open standard for collecting telemetry data. It can help reduce lock-in because your instrumentation can send data to different backends. You still need to design naming, sampling, and context propagation carefully.
Alerts should tell a human when action is needed. They should not report every interesting graph movement.
Good alerts usually have these traits:
If your team already ignores alerts, fix that before adding more. Alert fatigue is a reliability risk because it trains engineers to dismiss production signals. If this is happening now, use a focused process for reducing alert fatigue before your on-call rotation burns out.
The right tooling depends on your team size, architecture, budget, and appetite for running infrastructure. A seed-stage team with one backend service has different needs than a Series B company running Kubernetes, background workers, multiple databases, and customer-specific environments.
Use these decision criteria before picking a vendor or open-source stack:
Managed observability platforms are often the fastest path for small teams because they reduce maintenance work. Self-managed open-source tools can be a good fit when you have platform capacity, strict control requirements, or strong cost reasons. The risk is underestimating the time needed to run the stack well.
If you are comparing options, treat observability as part of your broader platform toolchain. The same tradeoffs apply to CI/CD, infrastructure as code, secrets, and runtime platforms. A structured approach to choosing DevOps tools can help you avoid buying overlapping products or adopting tools your team cannot maintain.
Your first observability stack should map to how engineers actually ship and debug software. If the stack lives outside daily workflows, it will decay.
A practical first version might look like this:
Deployment visibility is especially important. Many incidents are change-related. If a dashboard shows error rate rising at 14:05, engineers should be able to see whether a deploy, migration, feature flag change, infrastructure update, or dependency change happened at the same time.
If your team is still formalizing delivery workflows, observability should be part of that work. For teams using Azure DevOps, this may include tying releases, environments, and production checks into your broader setup. A startup-focused guide to setting up Azure DevOps can help you connect delivery practices with operational visibility.
Most observability problems come from unclear ownership, noisy data, or missing context. The tools matter, but the operating habits matter more.
Logs are useful, but they are not enough. During an incident, searching logs across services can be slow and incomplete. Metrics show the shape of the problem. Traces show the path of a request. Alerts bring attention to the issue. Logs then help explain the details.
A dashboard should support a decision. If nobody knows what action to take from it, remove it or redesign it. For example, a service overview dashboard should help an engineer decide whether the service is healthy, degraded, overloaded, or affected by a dependency.
CPU at 85% may or may not matter. A rising checkout failure rate matters. Database CPU can be useful as supporting evidence, but the page should usually come from user-facing symptoms or clear risk to production.
Telemetry volume grows quickly. Logs, traces, and high-cardinality metrics can become expensive if nobody owns retention, sampling, and filtering. Review volume by service. Set sane defaults. Keep high-value production data longer than low-value debug noise.
If every alert goes to the same general channel, response slows down. Each production service should have an owner, even if the owner is a small team rather than a dedicated platform group. Ownership includes dashboards, alerts, runbooks, and instrumentation quality.
As your company grows, this responsibility may move into a more formal platform or DevOps function. If you are approaching that point, it helps to plan how you will build a DevOps team instead of letting infrastructure ownership remain accidental.
You do not need to build the final version on day one. A staged approach keeps the work useful and manageable.
This is enough for a small team running a simple production system. It should help you detect obvious failures and inspect recent application behavior.
This stage fits teams with multiple services, workers, queues, or customer-facing reliability expectations. It reduces guesswork during incidents.
This stage helps when reliability has become a product and business concern. It also gives engineering leaders a better way to balance feature speed with production risk.
A good startup observability stack starts small, but it should not be random. Build around logs, metrics, traces, and alerts. Instrument the paths that matter to customers. Connect telemetry to deploys and ownership. Keep alerts actionable. Review cost and noise before they become bigger problems.
If your team can quickly answer what broke, who is affected, and what changed, your stack is doing its job. If not, fix the highest-friction gap first instead of adding another disconnected tool.

