


.avif)

.avif)


%20(2).avif)


.svg)


Biotechnology
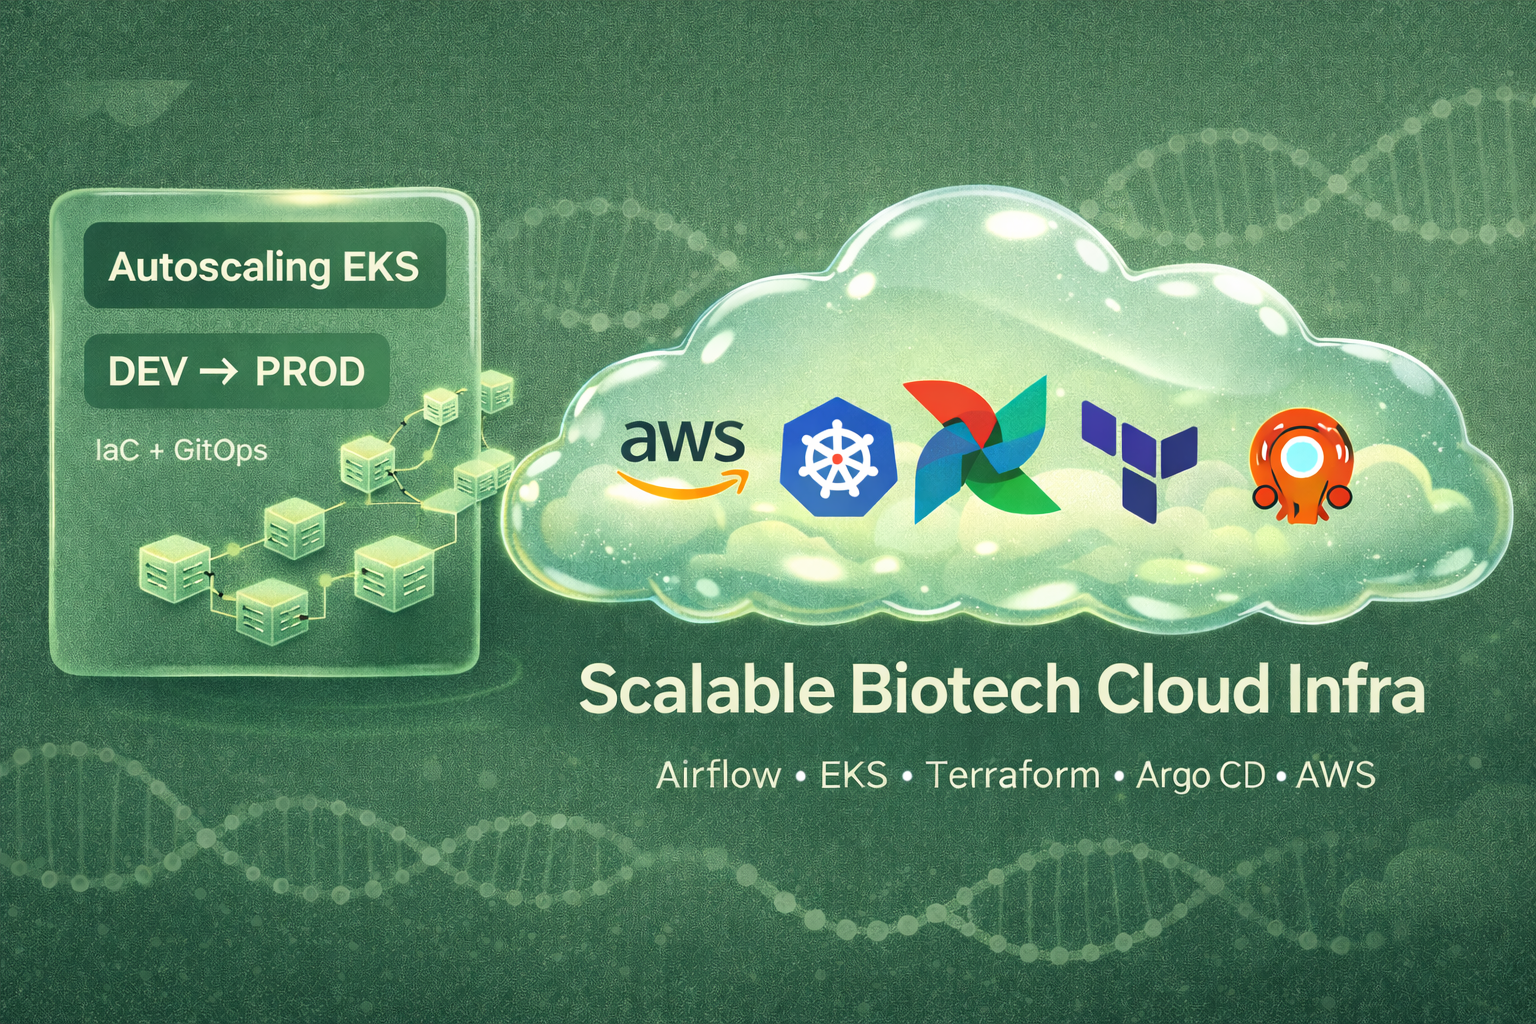
Scalable Biotech Cloud Infrastructure with Apache Airflow, Kubernetes, AWS, and Terraform
We used Terraform & Terragrunt to create the infrastructure, Kubernetes (AWS EKS) to orchestrate everything, Argo CD for GitOps, and Apache Airflow deployed on the Kubernetes cluster, and a DEV and a PROD environments for a smooth development process.